Platform

Five domains on one graph, with an AI SRE that shows its work.

Meerstack brings monitoring, service management, security, models and robots onto one object graph. Each section below shows what you would expect from a dedicated tool, what those tools leave out and what is new. We mark what is still in development.

One object graph. Business journeys, services, hosts, databases and GPUs are registered as linked objects. An incident starts at the journey that is failing and follows the links down to the part that broke.

  1. Card Authorizationjourney
  2. card-auth-switchservice
  3. fraud-model-servinginference service
  4. gpu-b2-08host
  5. GPU 2GPU

Sample data from Meer Bank, a fictional bank we use for demos.
Observe

Monitoring that knows what an outage costs.

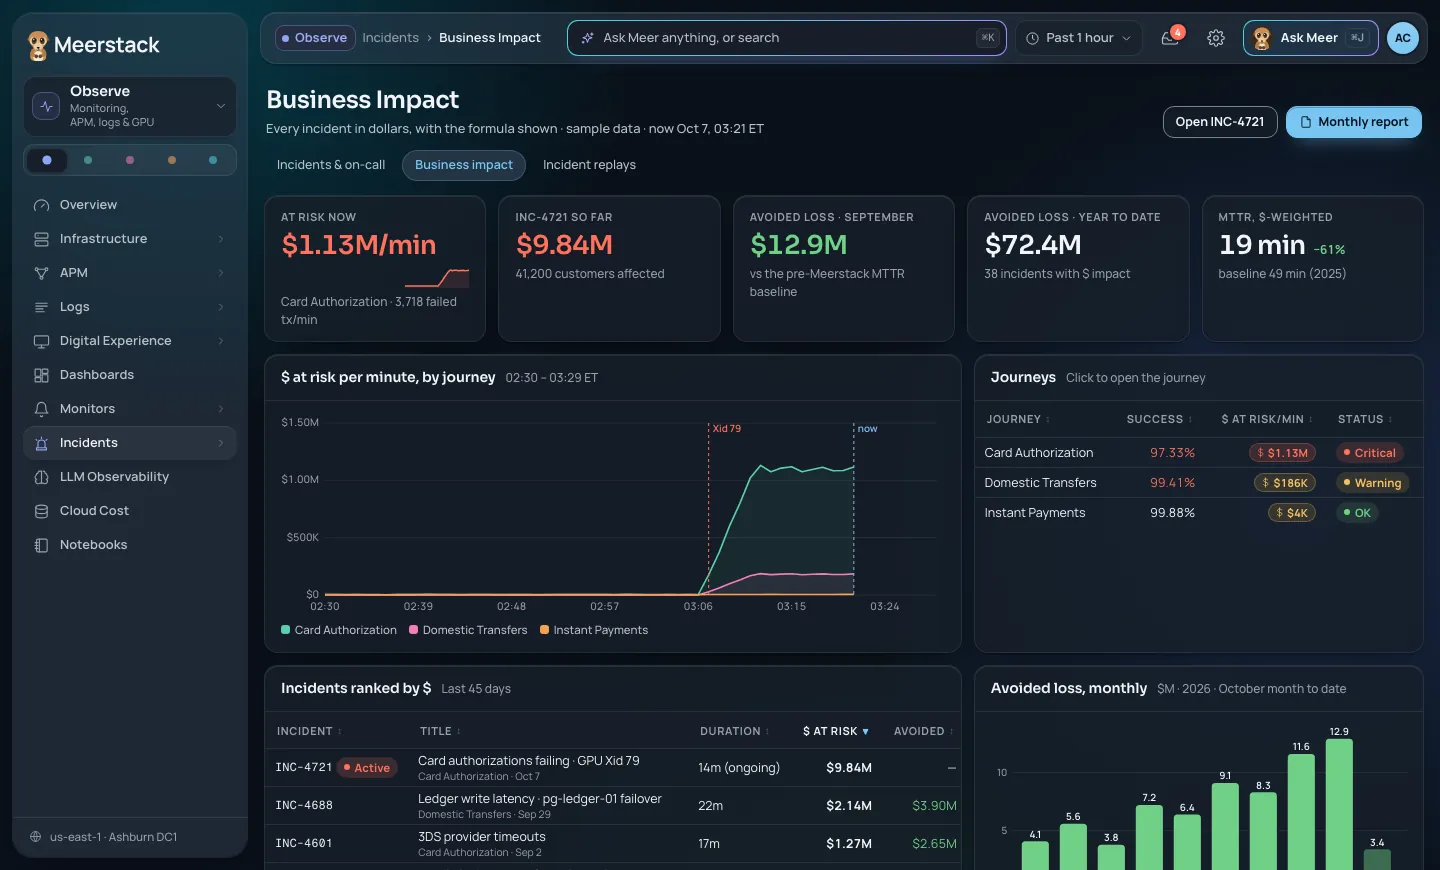
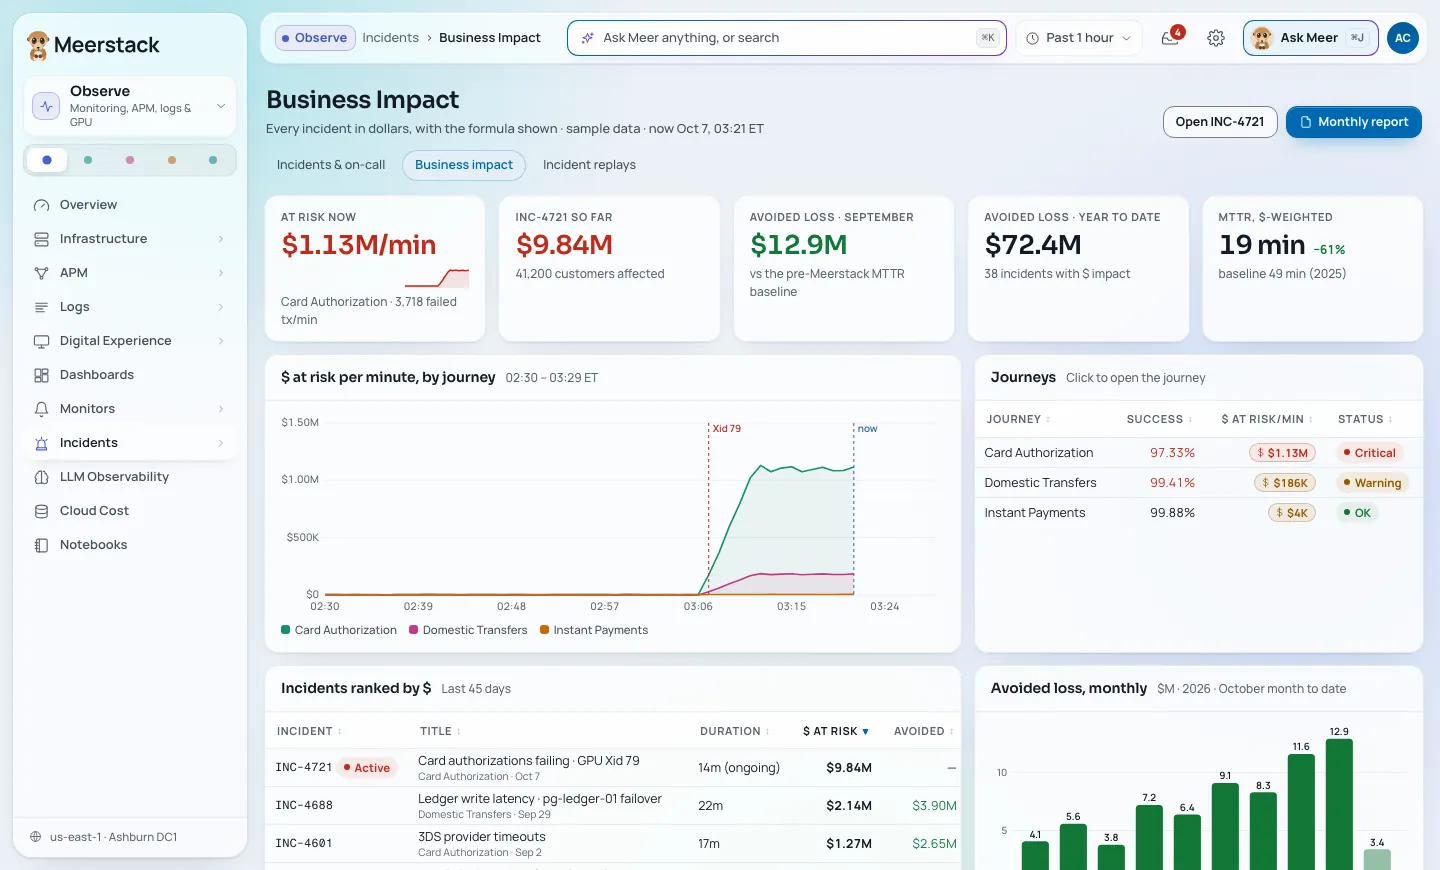
Metrics, logs, dashboards and monitors, compatible with the agents you already run. Every incident on a business journey shows the dollars at risk per minute.

Business impact view: dollars at risk per minute by journey, with incidents ranked by costBusiness impact view: dollars at risk per minute by journey, with incidents ranked by cost
Interface preview with sample data. Some screens show features still in development.

What you'd expect

  • Metrics ingest with a query language, formulas, and anomaly, forecast and outlier functions
  • Log ingest, search and an explorer; log pipelines with grok parsing; archives to S3-compatible storage
  • Dashboards and monitors (metric, log, event, service check, composite), downtimes with recurrence
  • Distributed tracing and APMIn development
  • Real-user monitoring and synthetic testsIn development

What others lack

  • Dollars at risk per minute on each incident, estimated from failed transactions on the business journey and its average value
  • One estimate, used everywhere: the 3D topology, the root-cause analysis and the incident replay

What's new

  • A 3D stack view from the business journey down to the GPU, with the blast radius highlighted
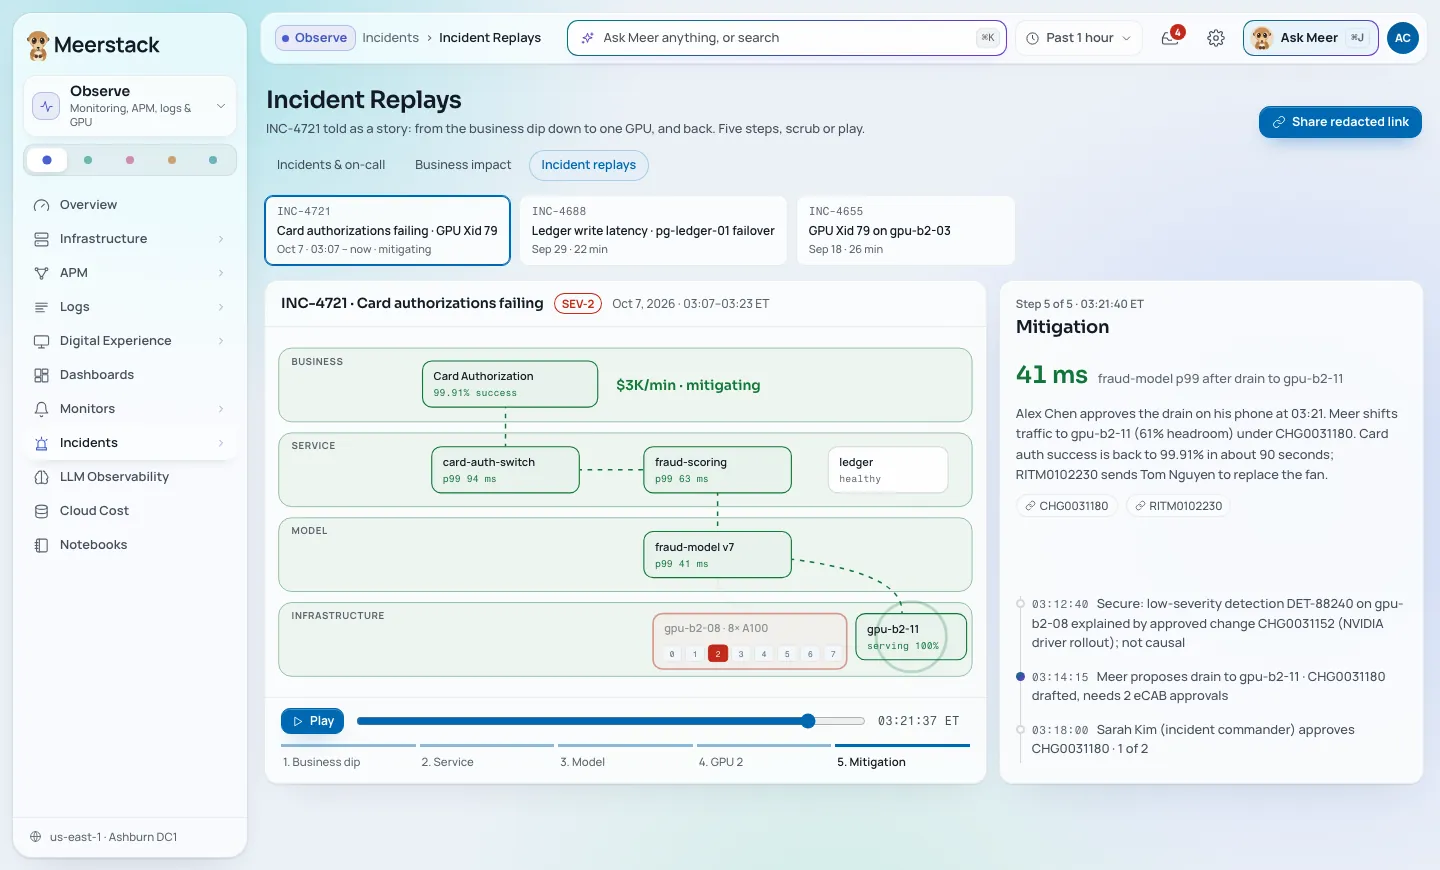
  • Incident replay: a frozen, step-by-step story of each incident that you can share as a redacted link
  • A lightweight Rust agent with GPU metrics (NVML/DCGM). Early version, Linux only
Service

On-call and CMDB on the graph your monitors use.

Schedules, escalations and paging run on the same objects as your monitors, so the person paged sees the service, the host and the change in one place.

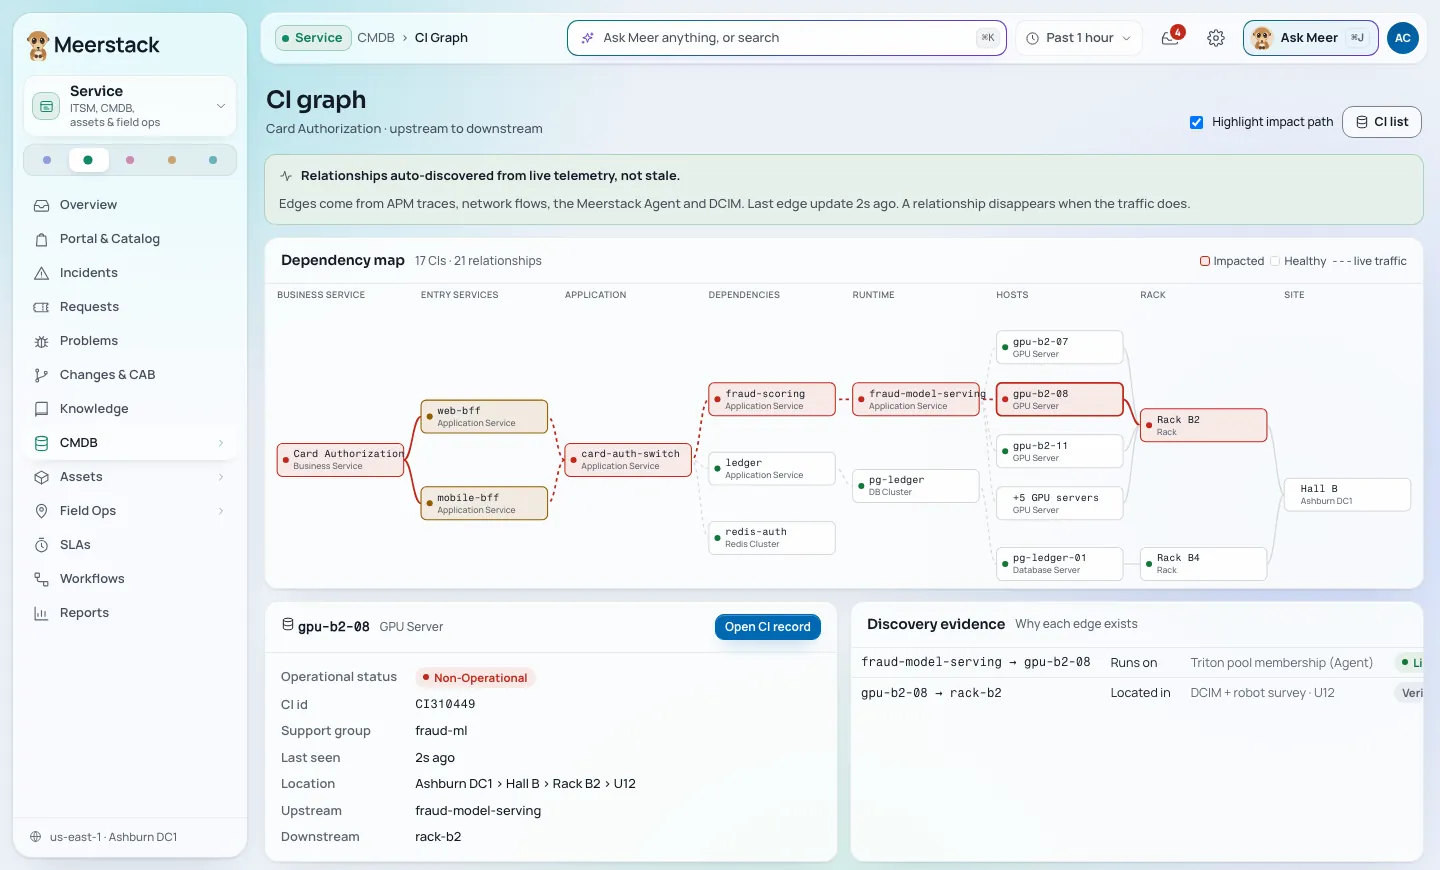
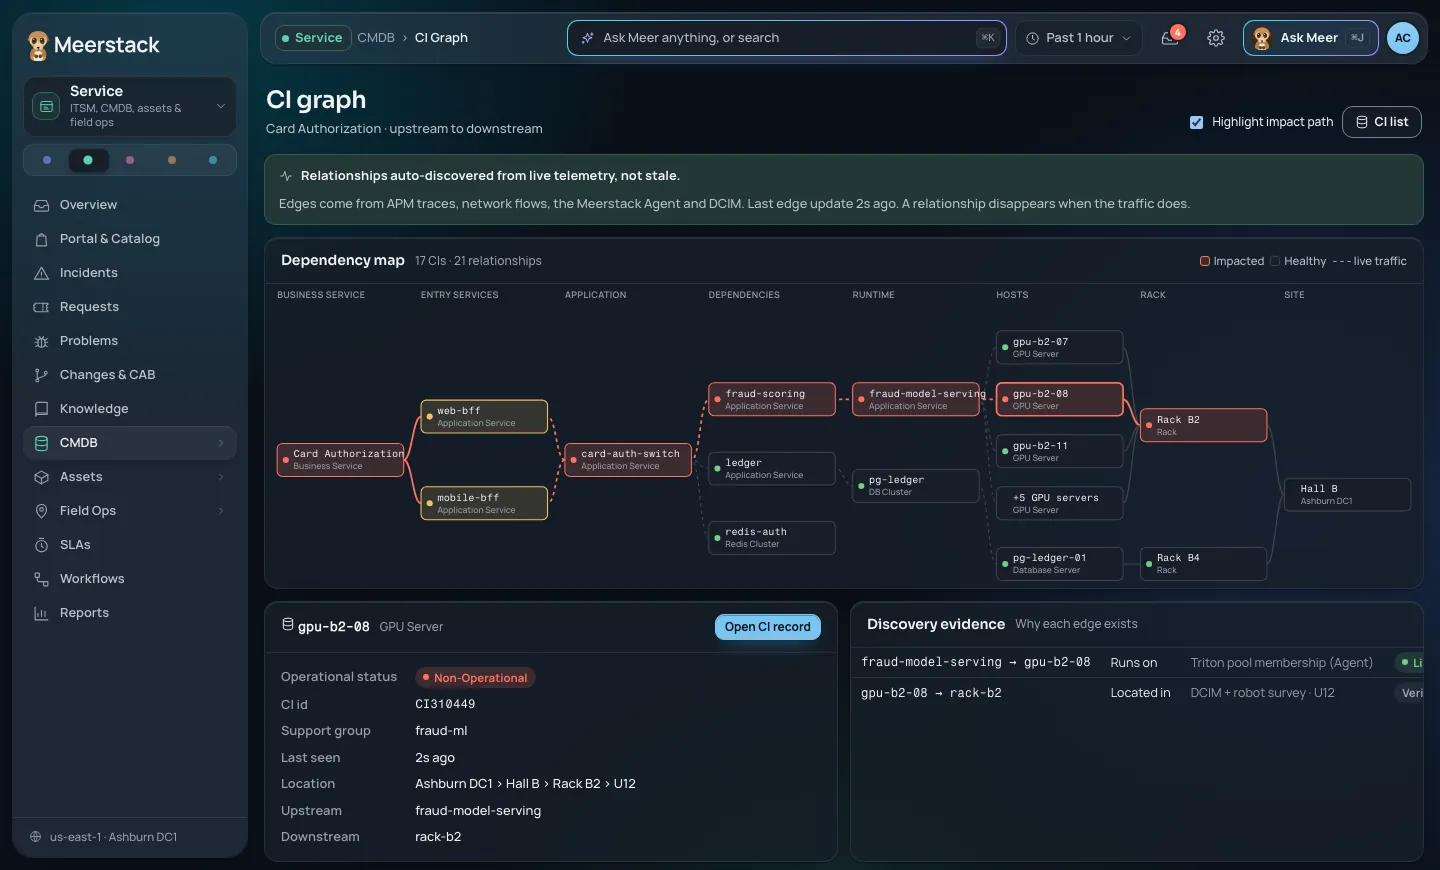
Configuration item graph from the business service down to racks and the site, with the impact path highlightedConfiguration item graph from the business service down to racks and the site, with the impact path highlighted
Interface preview with sample data. Some screens show features still in development.

What you'd expect

  • On-call schedules with rotation layers, restrictions and overrides, and handoffs that stay correct across daylight saving
  • Escalation policies with repeat loops, and paging by push, email, SMS, voice, Slack and webhook
  • Incidents you can create, acknowledge, escalate and resolve
  • Change requests with CAB approval, problems, a request catalog, a knowledge base and SLAsIn development

What others lack

  • A CMDB built from the same graph as your telemetry: journeys, services, hosts, databases and GPUs, registered and linked through audited actions
  • Change events from CI/CD land on the incident timeline next to the alerts

What's new

  • Monitors can page through Meerstack on-call or through supported paging tools, so you can run both
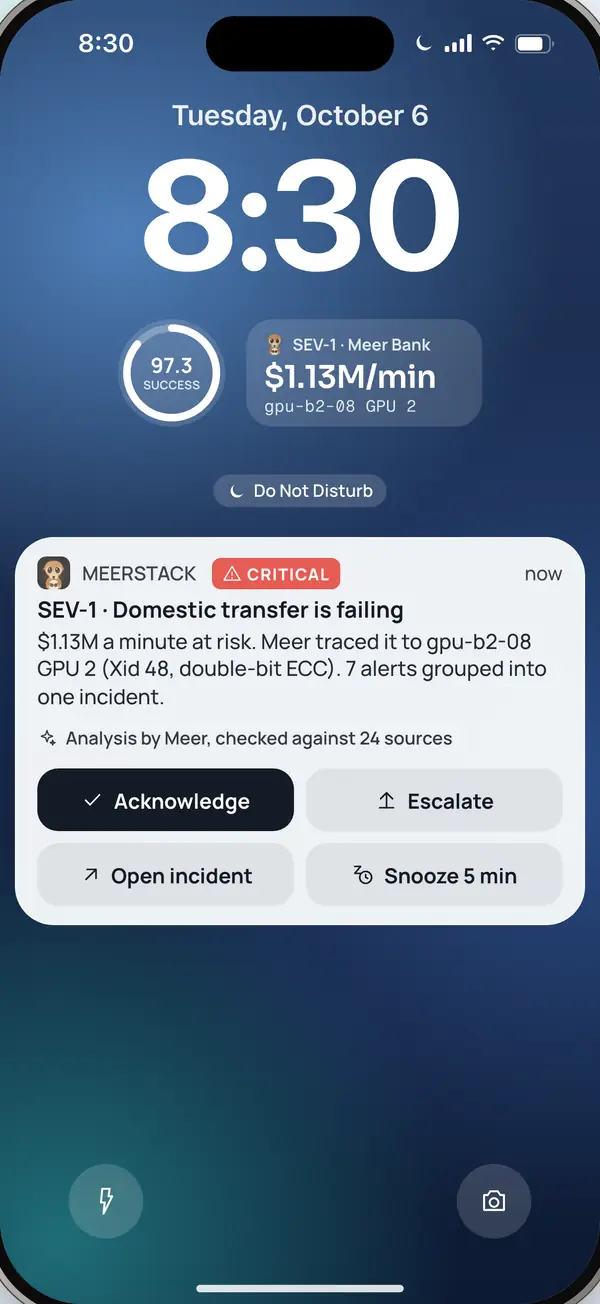
  • Push pages that you can acknowledge or escalate straight from the notification
Secure

Security operations, on the same graph.

Security operations is the newest domain. What ships today protects the agent fleet itself; detections and triage are in development.

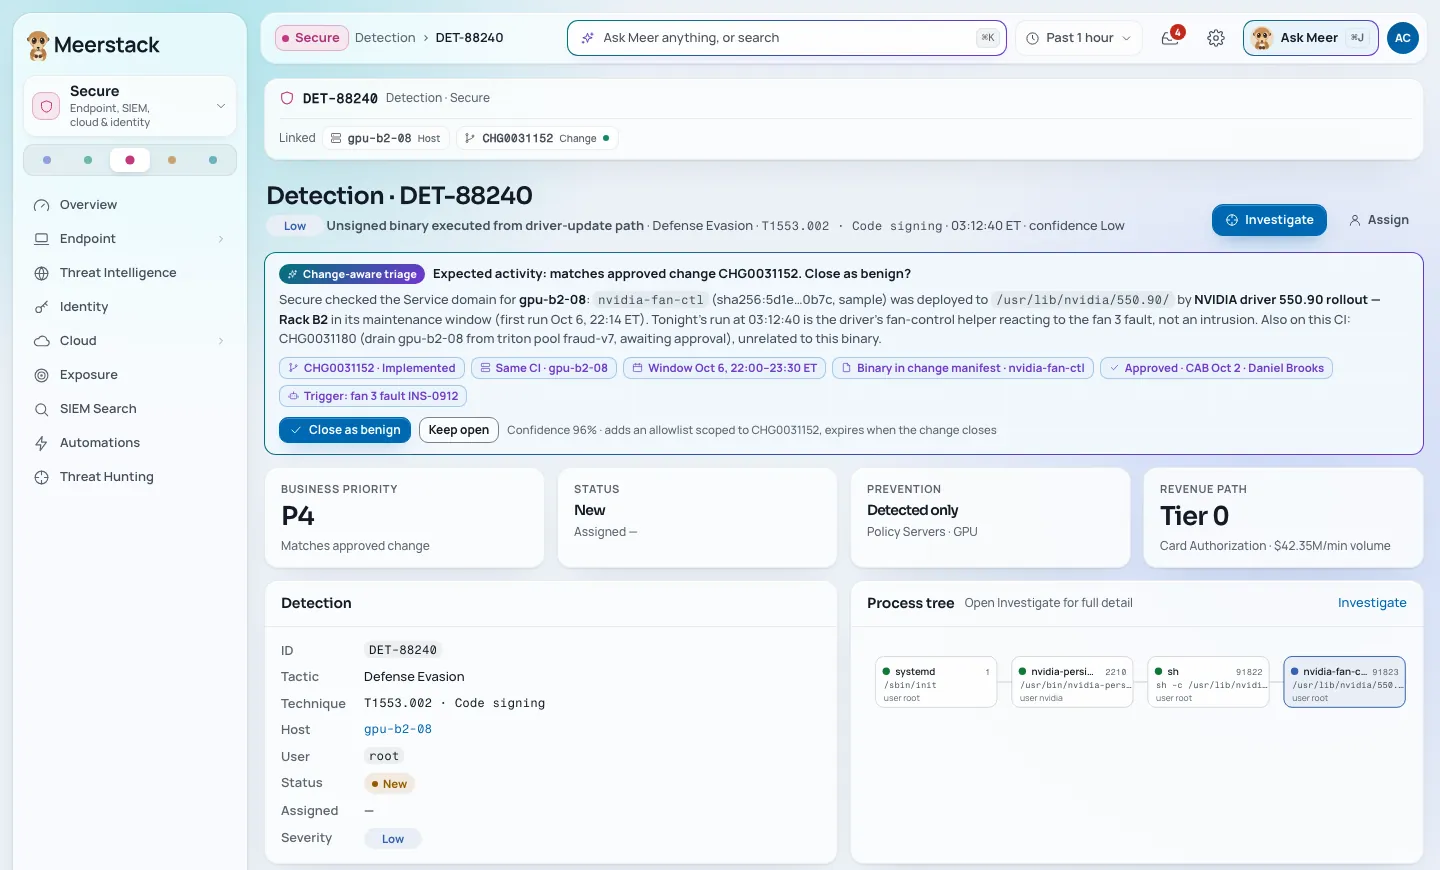
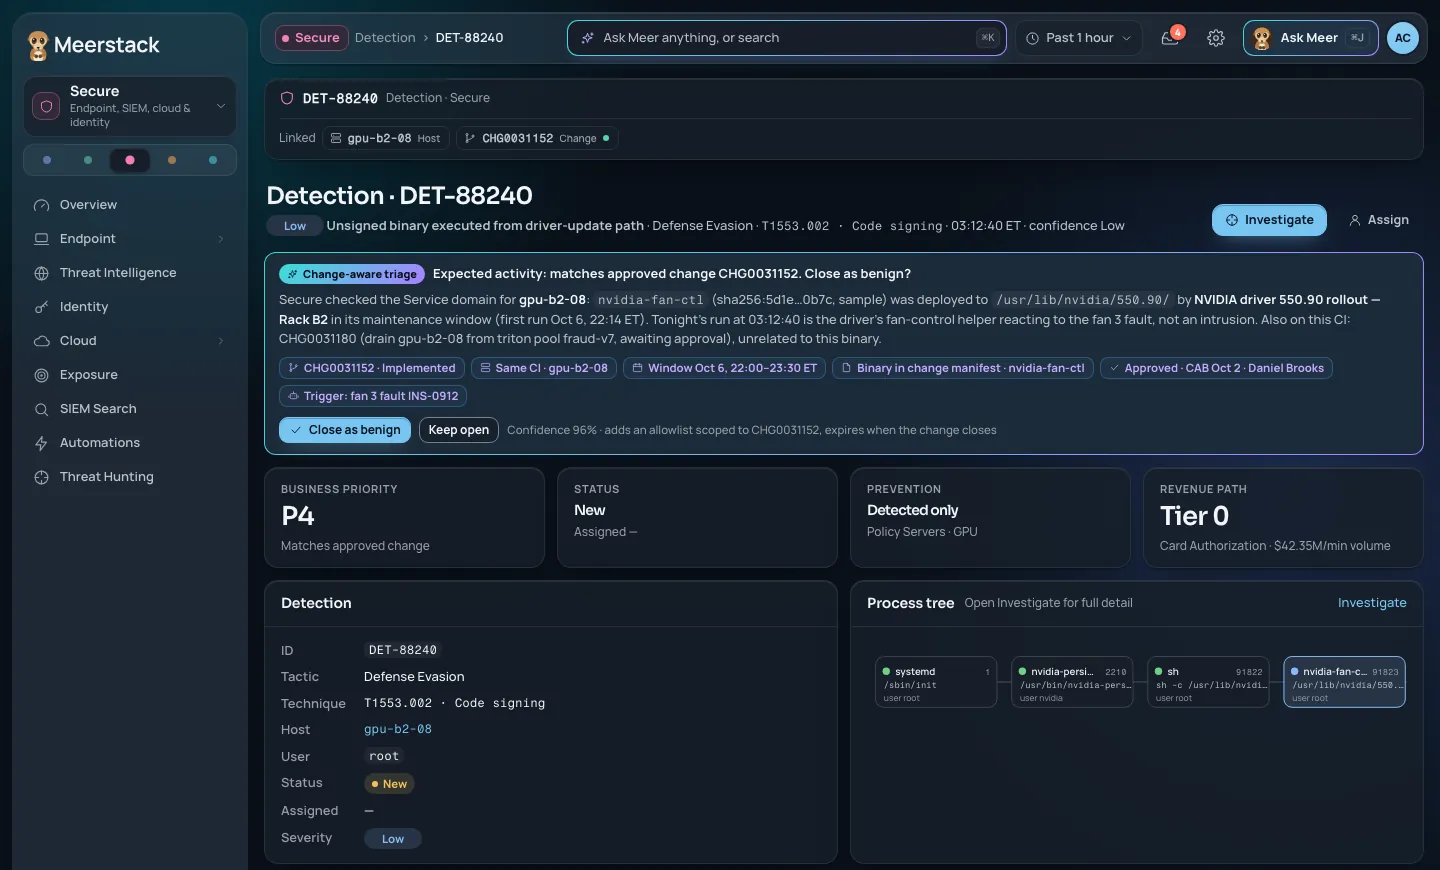
Detection view: a detection explained by an approved change, with linked host, change and process treeDetection view: a detection explained by an approved change, with linked host, change and process tree
Interface preview with sample data. Some screens show features still in development.

What you'd expect

  • SIEM search and detection rulesIn development
  • Endpoint, cloud posture, identity and vulnerability viewsIn development
  • Automation playbooksIn development

What others lack

  • Agent content is signed (Ed25519) and released ring by ring, with automatic pause and one-click rollback
  • Change-aware triage: a detection that matches an approved change is explained by that changeIn development

What's new

  • Detections linked to the same hosts, changes and owners as your incidentsIn development
MaaS

From compute to tokens, on one bill of health.

GPUs and the models they serve sit on the same graph as everything else. A failing GPU shows up as a failing journey, priced, with a GPU-specific fix.

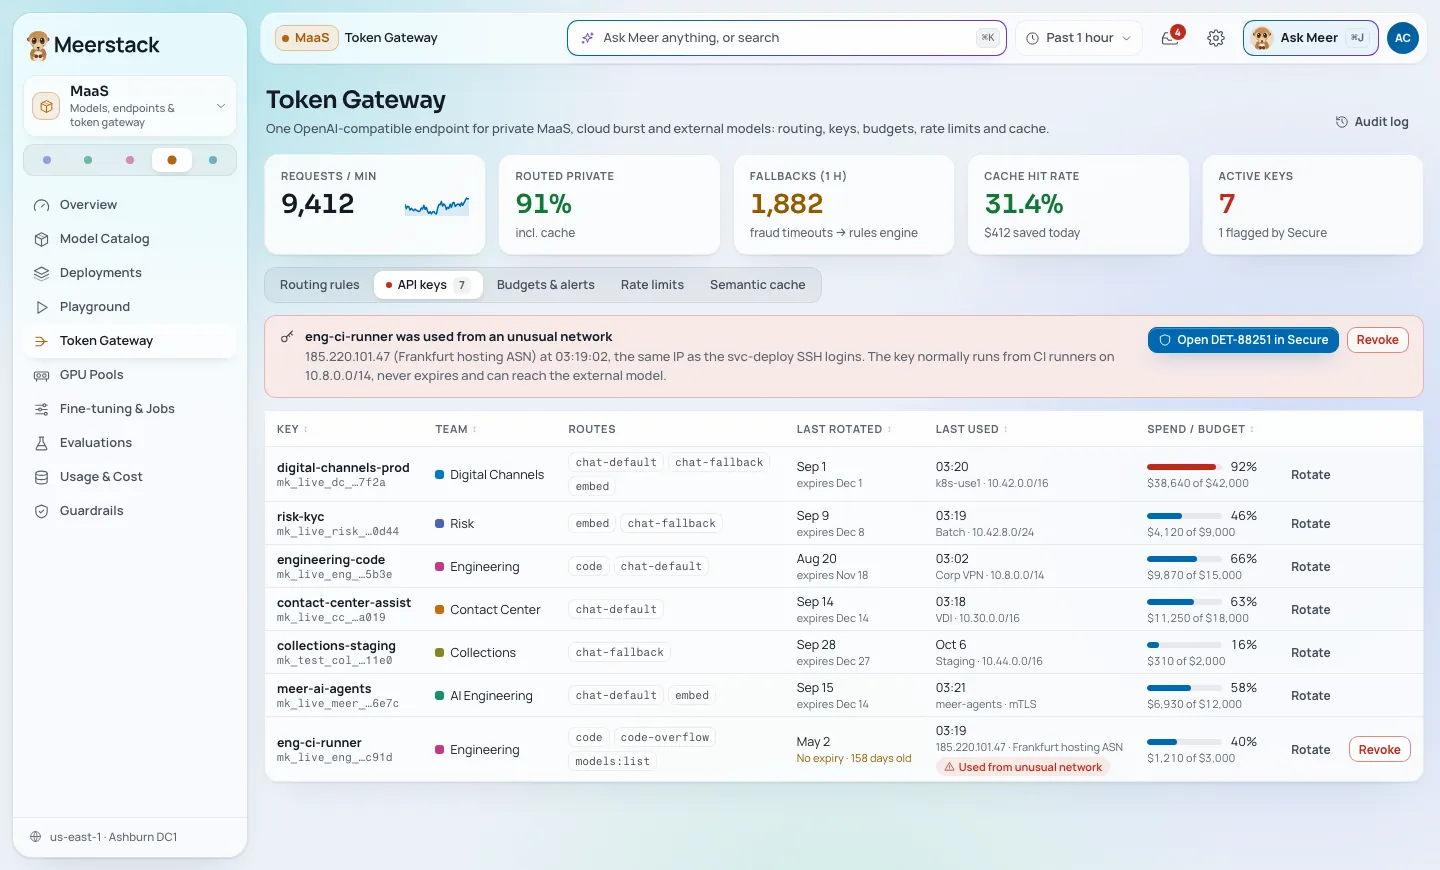
Token gateway preview: API keys by team with spend against budget and a key flagged for unusual useToken gateway preview: API keys by team with spend against budget and a key flagged for unusual use
Interface preview with sample data. Some screens show features still in development.

What you'd expect

  • GPU health metrics from the Meerstack agent (NVML/DCGM)
  • GPUs, models, inference services and training jobs modelled in the object graph
  • A token gateway with per-team keys, budgets, rate limits and cachingIn development
  • Model catalog, deployments, GPU pools and guardrailsIn development

What others lack

  • Root-cause analysis that knows GPU faults: Xid error codes map to a specific runbook instead of "restart the service"
  • Model-serving incidents priced in dollars at risk, like any other journey

What's new

  • Spend and latency per team across private and external modelsIn development
Robotics

Inspection robots, tied to the racks they inspect.

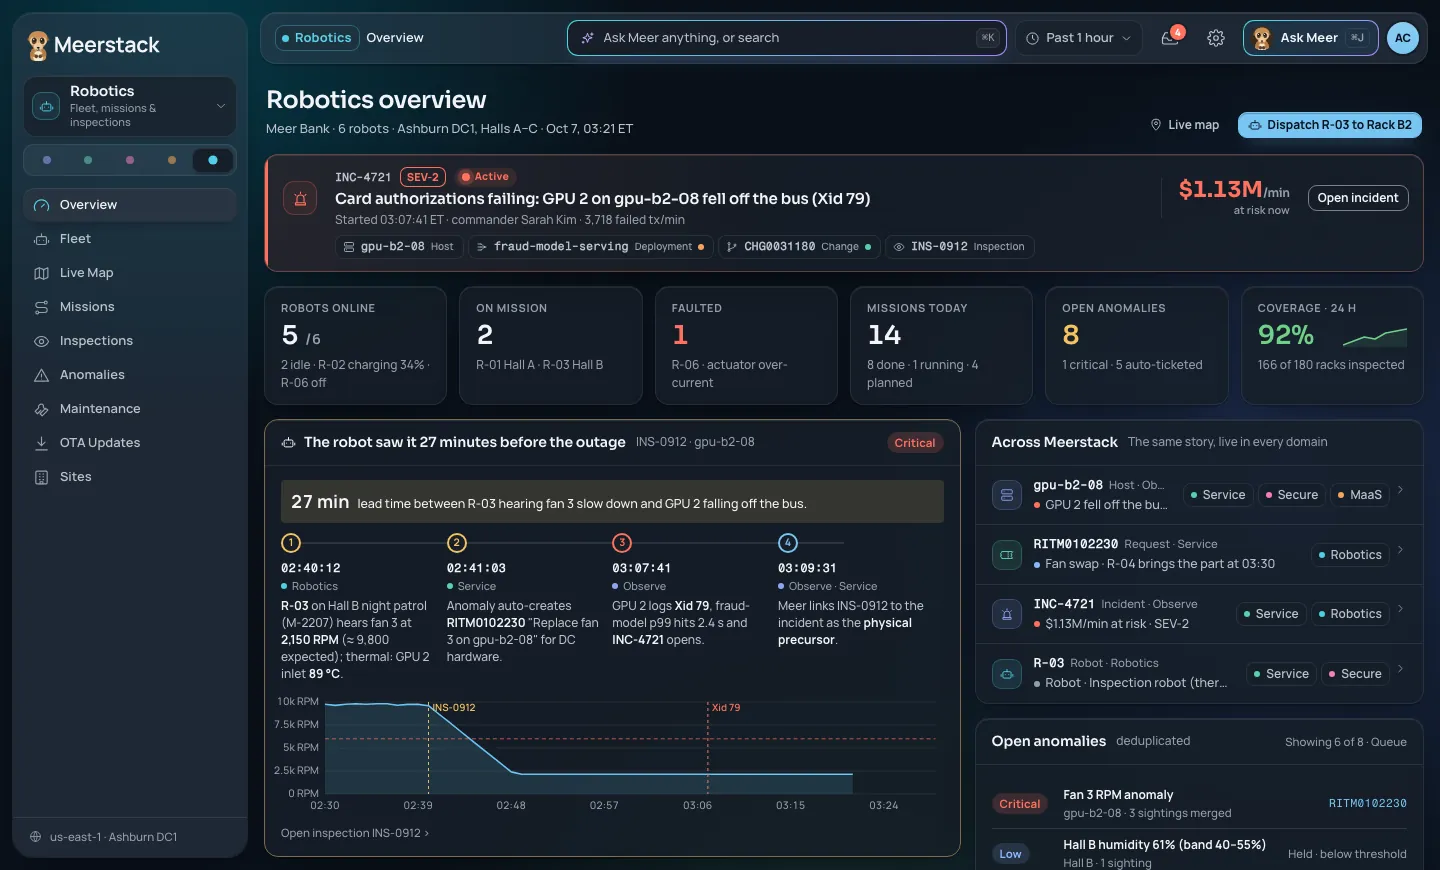
Robots, missions and their findings become objects on the graph, next to the hosts, racks and incidents they relate to.

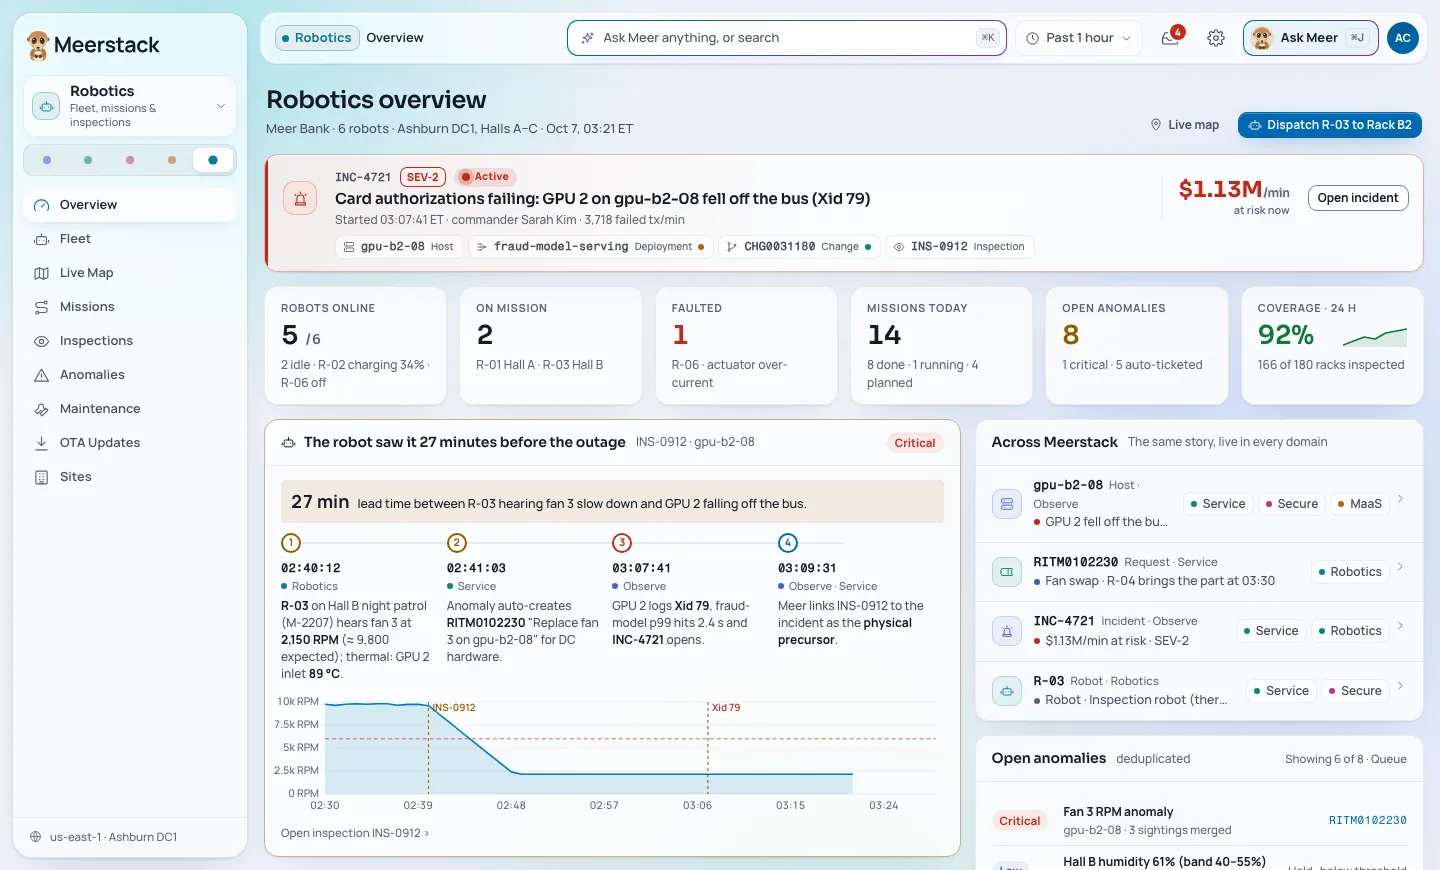
Robotics overview: fleet status, missions and an inspection that preceded an incidentRobotics overview: fleet status, missions and an inspection that preceded an incident
Interface preview with sample data. Some screens show features still in development.

What you'd expect

  • An API for sites, fleets, robots and missions, with telemetry ingest
  • Robot incidents and offline detection
  • An on-site gateway with a local safety-stop policy and disk buffering when the link drops
  • Fleet console, live map and over-the-air update deliveryIn development
  • ROS 2 bridgeIn development

What others lack

  • Robot telemetry in the same platform as the IT systems the robots inspect

What's new

  • An inspection finding linked to the incident it preceded, so the physical cause is part of the root causeIn development
Meer AI SRE

Meer finds the cause and proposes the fix. Your people decide.

Meer reads metrics, logs, topology and changes, cites its evidence and writes a fix you can roll back. The approval rules are enforced in code, not in a prompt.

MeerMeer · root cause92% confidenceSample data
Card authorizations are failing because GPU 2 on gpu-b2-08 dropped off the bus. Draining the host to gpu-b2-11 is reversible and should restore the journey.
  • log · Xid 79 on GPU 2
  • metric · fraud-model p99
  • path · journey → GPU
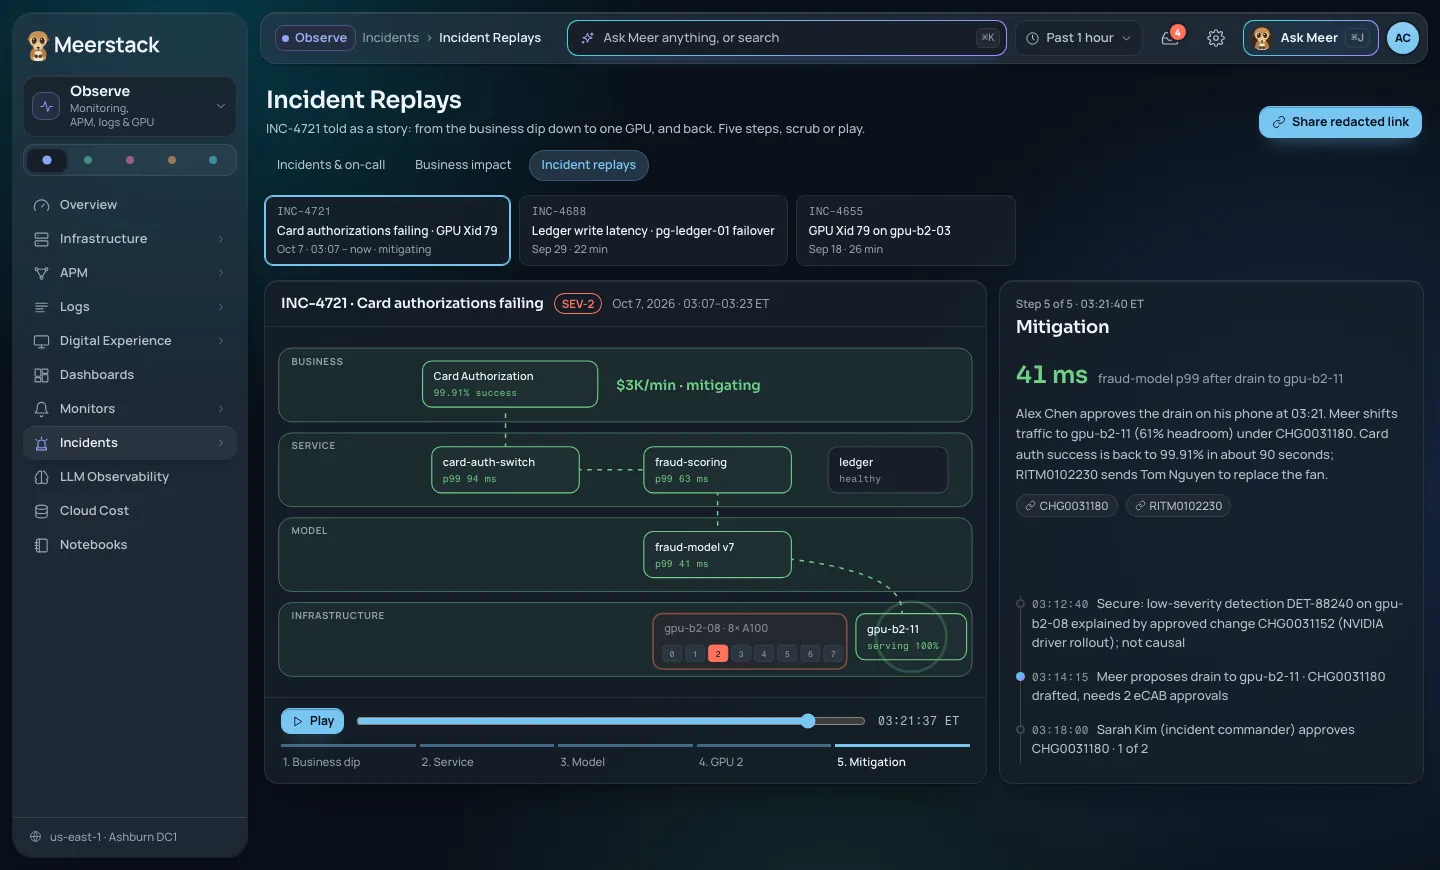
Incident replay: the incident told in five steps from the business dip down to one GPU and backIncident replay: the incident told in five steps from the business dip down to one GPU and back
Interface preview with sample data. Some screens show features still in development.
  1. 01

    Root cause

    A causal-graph ranking and a language model work together. Each hypothesis carries its evidence and a confidence score, and runs on live data.

  2. 02

    Fix proposals

    Meer proposes an action with its blast radius. Actions can be rolled back, and a rollback is refused if the object changed since.

  3. 03

    Approvals

    You set an autonomy level for each action, from L0 to L3. High-risk actions become proposals that a person must approve, in the console or in Slack. Meer can never approve, and approval policies can require two different people.

  4. 04

    Audit

    Every action is logged with who asked, who approved and what changed. Other AI agents get the same tools and the same limits over MCP.

Mobile

Get paged and act from your phone.

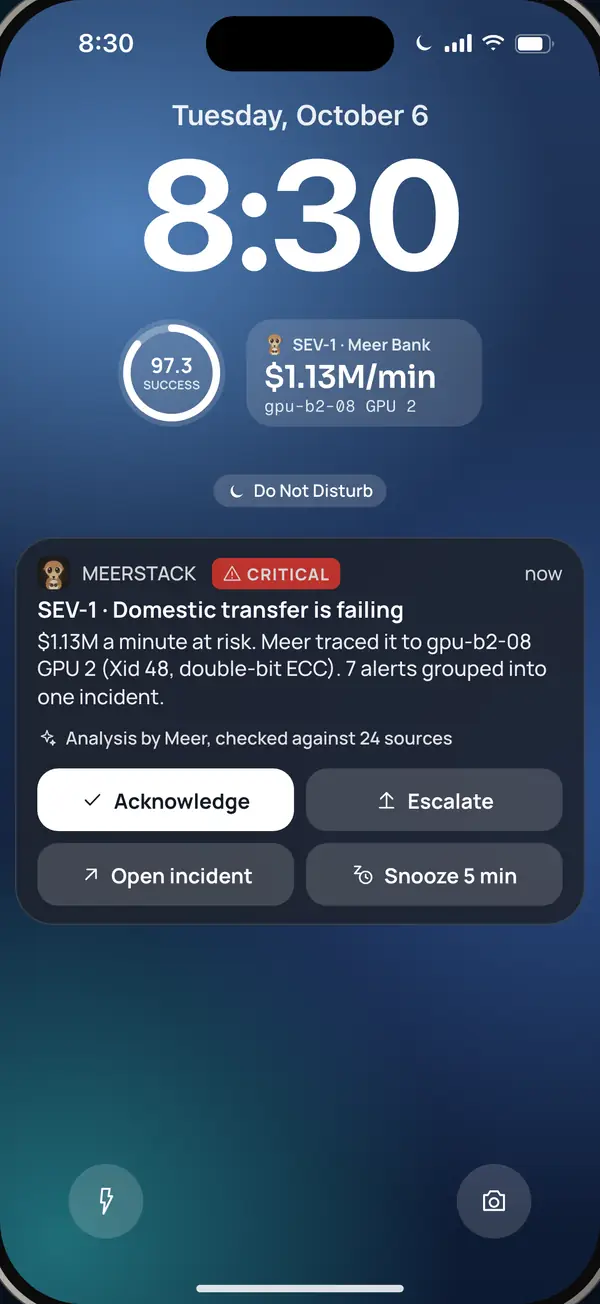
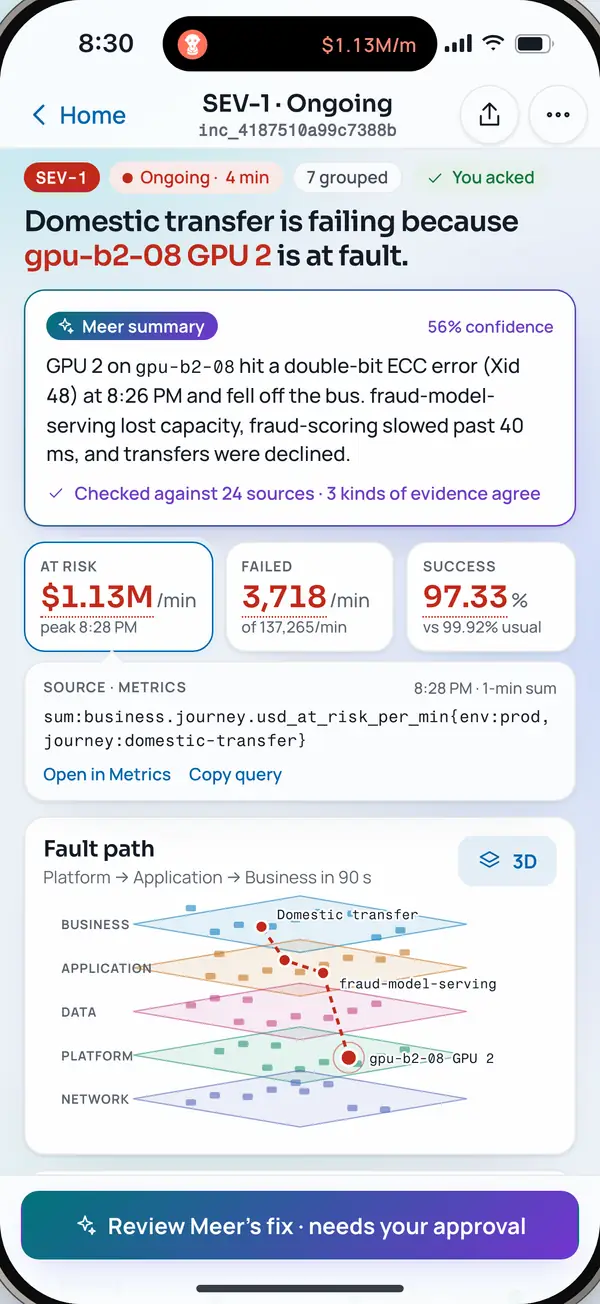
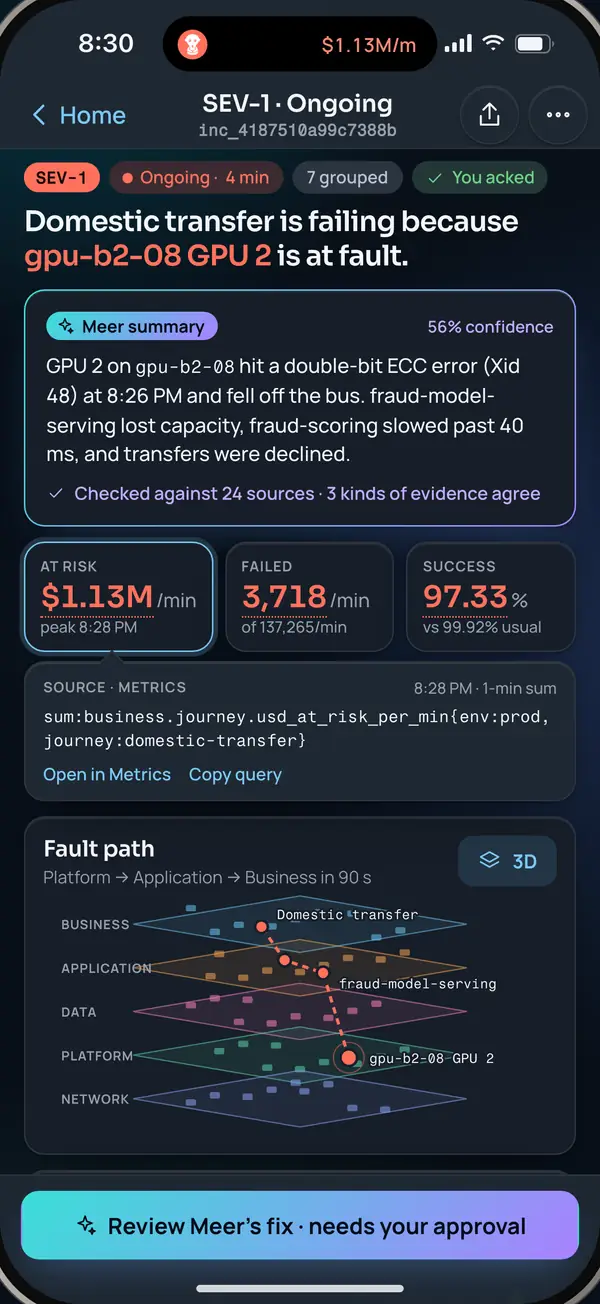
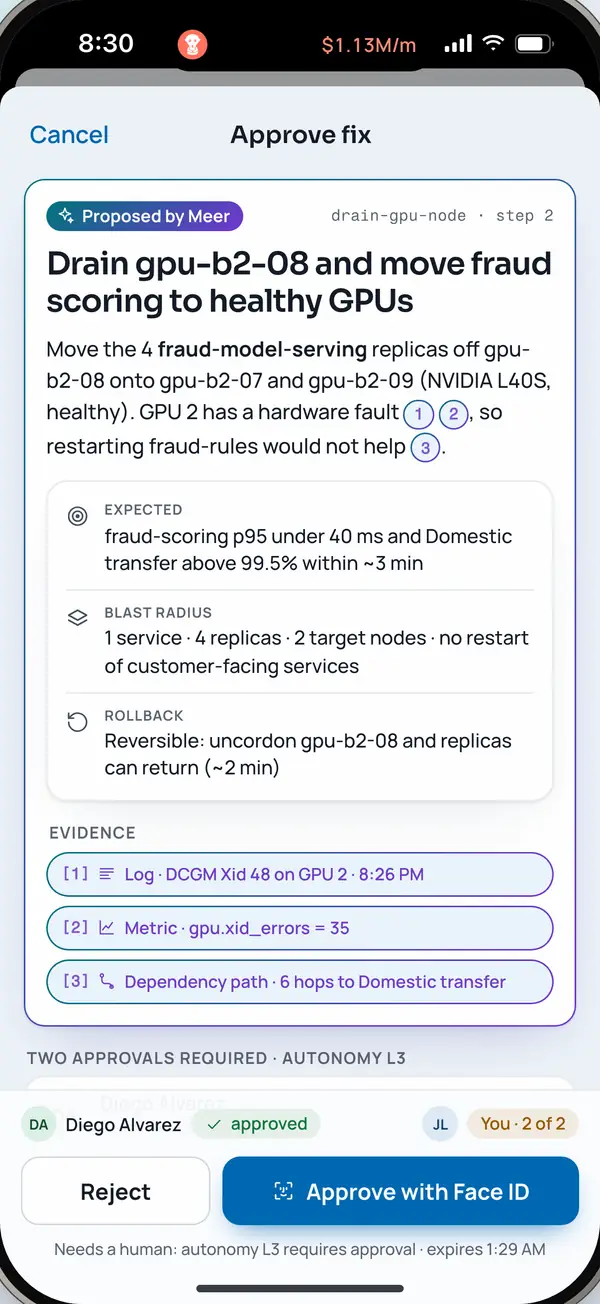
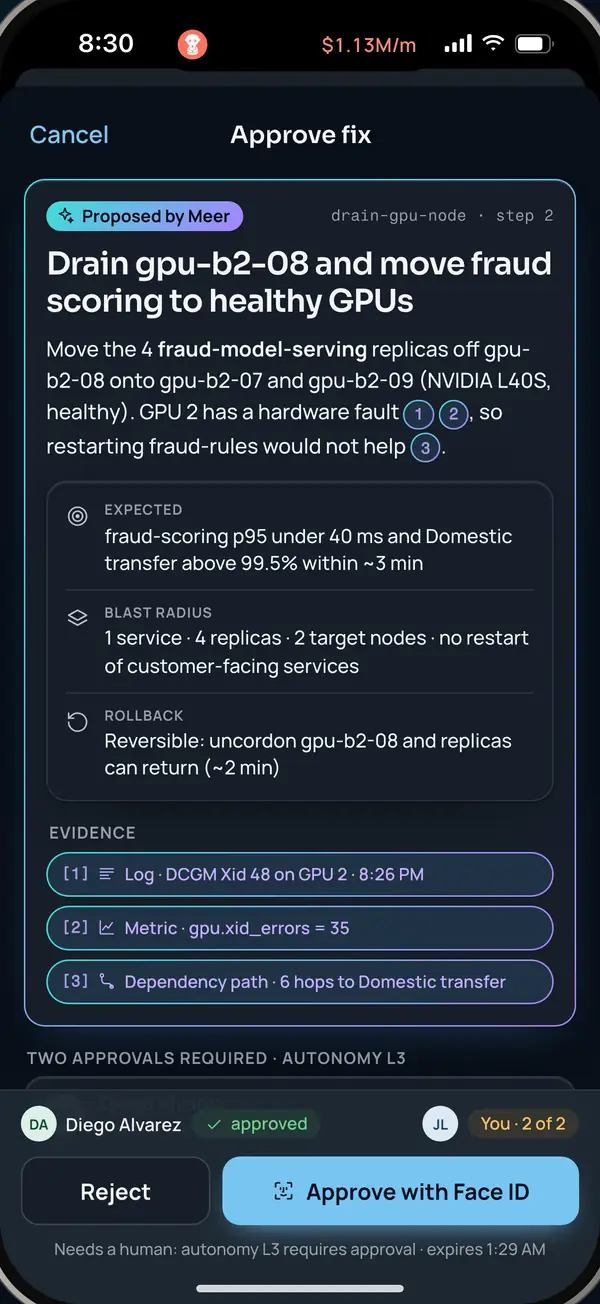
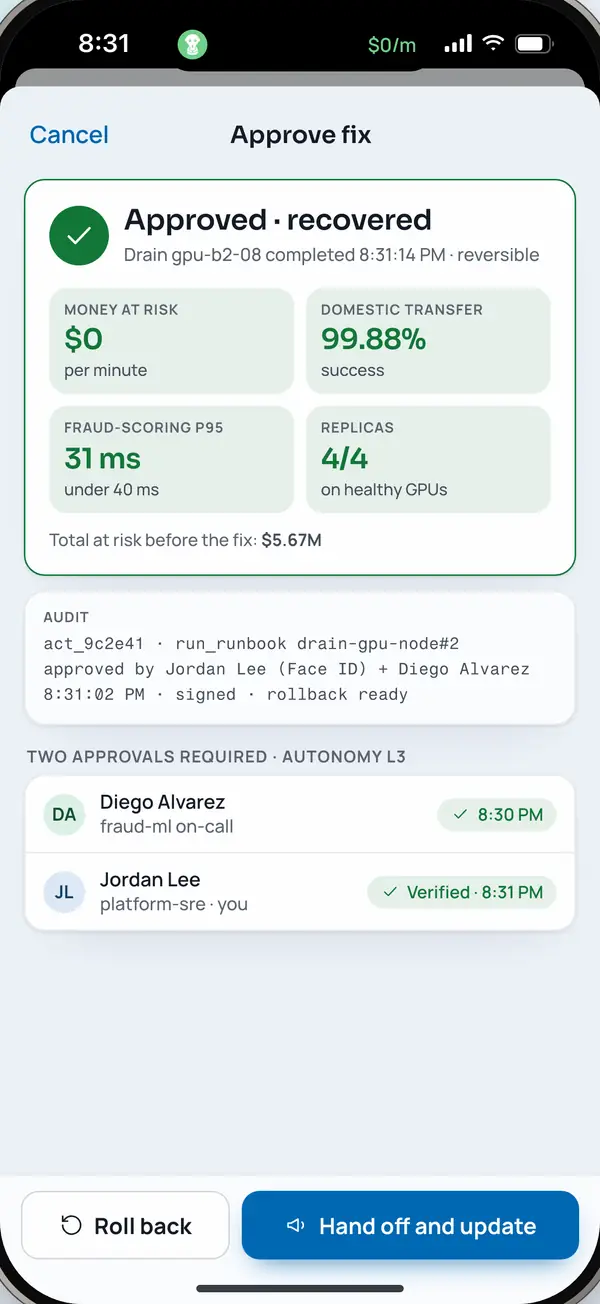
The Meerstack app for iOS and Android is in development. Paging already works: you get a push and can acknowledge or escalate from the notification. Approving a fix with Face ID is next. The clickable 90-second demo shows the full flow.

  1. Phone lock screen with a SEV-1 page showing dollars at risk per minutePhone lock screen with a SEV-1 page showing dollars at risk per minute
    0:00 Paged, with dollars at risk
  2. Incident screen opening on Meer’s answer, with evidence and dollars at riskIncident screen opening on Meer’s answer, with evidence and dollars at risk
    0:20 The incident opens on the answer
  3. Approve fix screen with blast radius, rollback plan, cited evidence and two approversApprove fix screen with blast radius, rollback plan, cited evidence and two approvers
    0:43 Evidence, blast radius, rollback
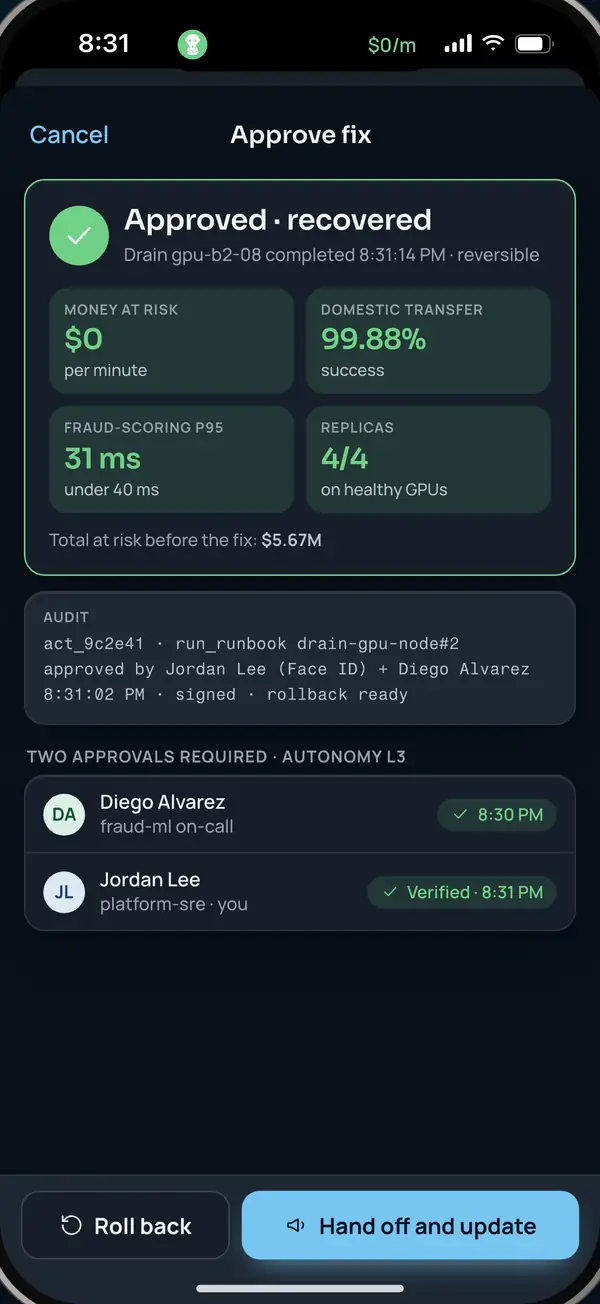
  4. Confirmation that the fix was approved, with the audit trail writtenConfirmation that the fix was approved, with the audit trail written
    1:12 Approved and audited
  • Push paging on iOS and Android, with acknowledge and escalate from the notification
  • Fixes follow the same approval rules everywhere: high-risk actions need a person
  • Approve fixes with Face ID (in development)
  • App store release (in development)

Phone screens are from the clickable demo: a prototype with sample data. Timings are the demo script, not a measurement.

See it on an incident.

Click through the 90-second demo, or spend 20 minutes with a founder.